Journey Mapping
Challenge: The bathroom business had a problematic shopping experience, but entering into a new bath campaign allowed us to improve.
Action: To understand the issues facing customers undergoing a bathroom remodel, I conducted interviews. Based on their feedback, I developed emotional journey maps to demonstrate the challenges facing customers and guide the development of the campaign. I also carried out additional research into product assortment, and used it to develop a new site content and shopping strategy. The charts below demonstrate the challenges and show the plan for implementing changes.
This chart displays the emotional journey of customers throughout a bathroom remodeling project.
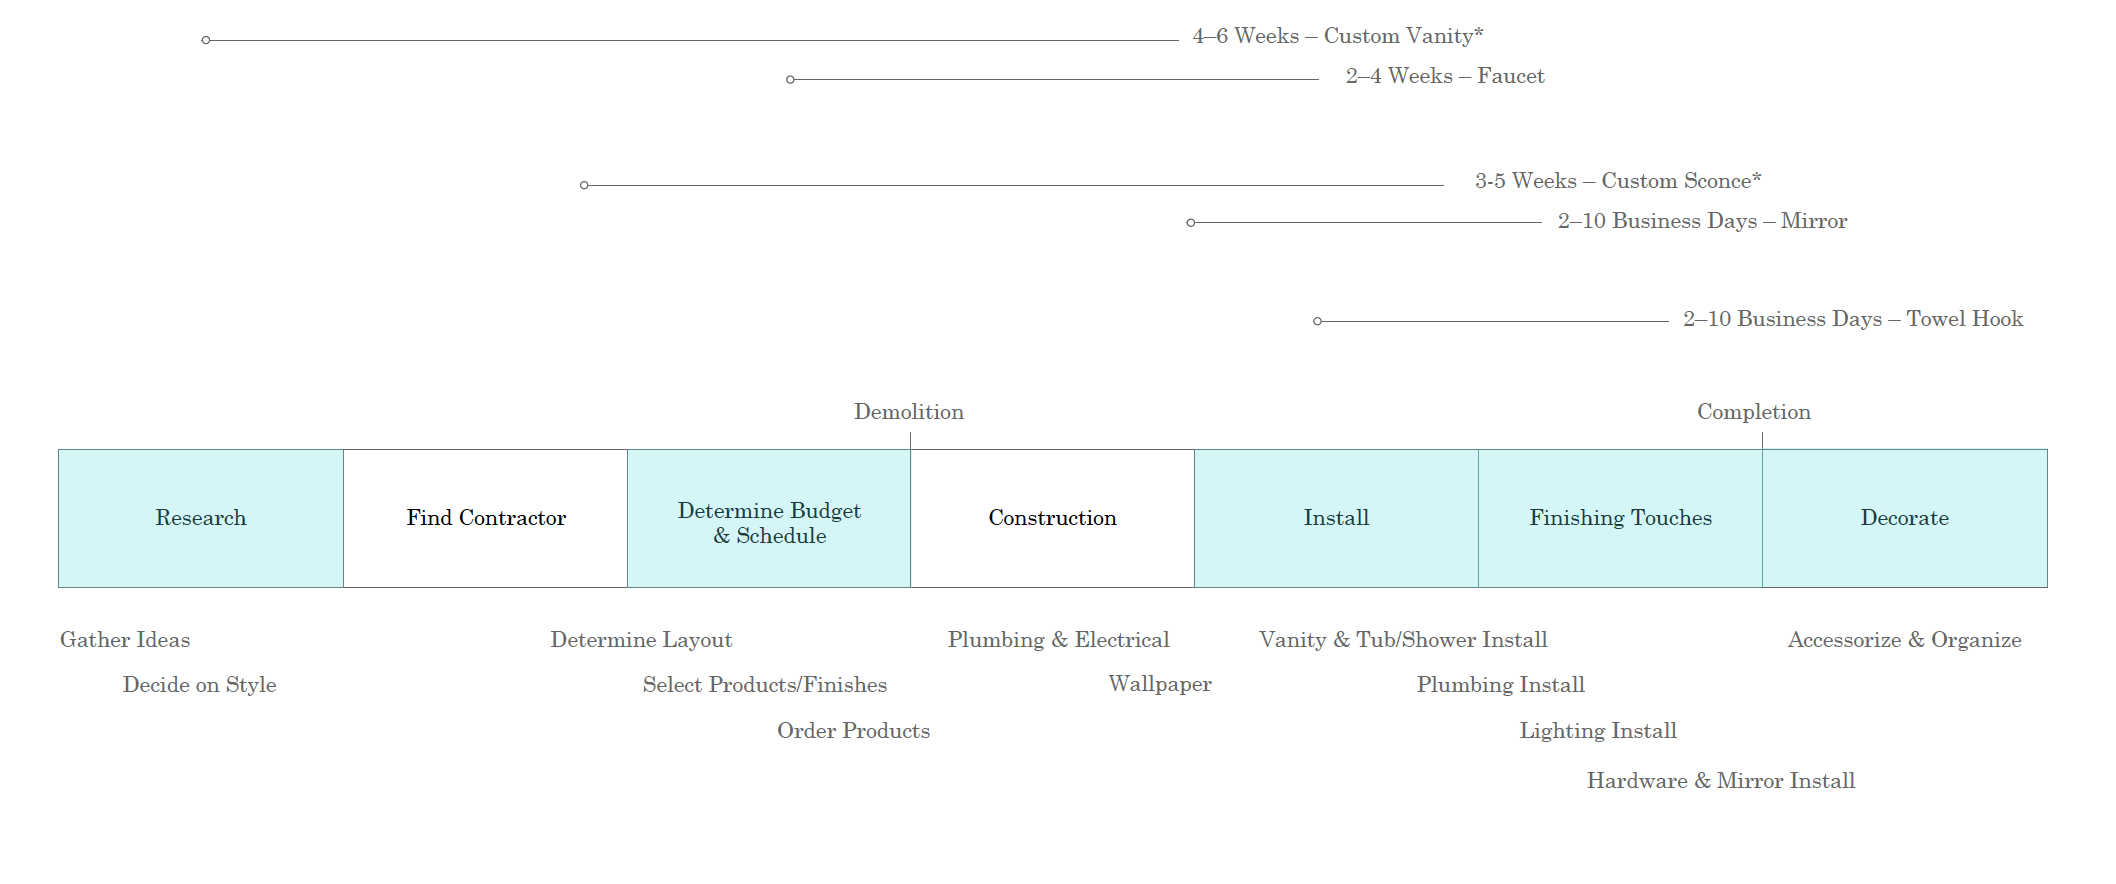
This map groups frequently purchased items and overlays shipping timelines while highlighting key customer issues.
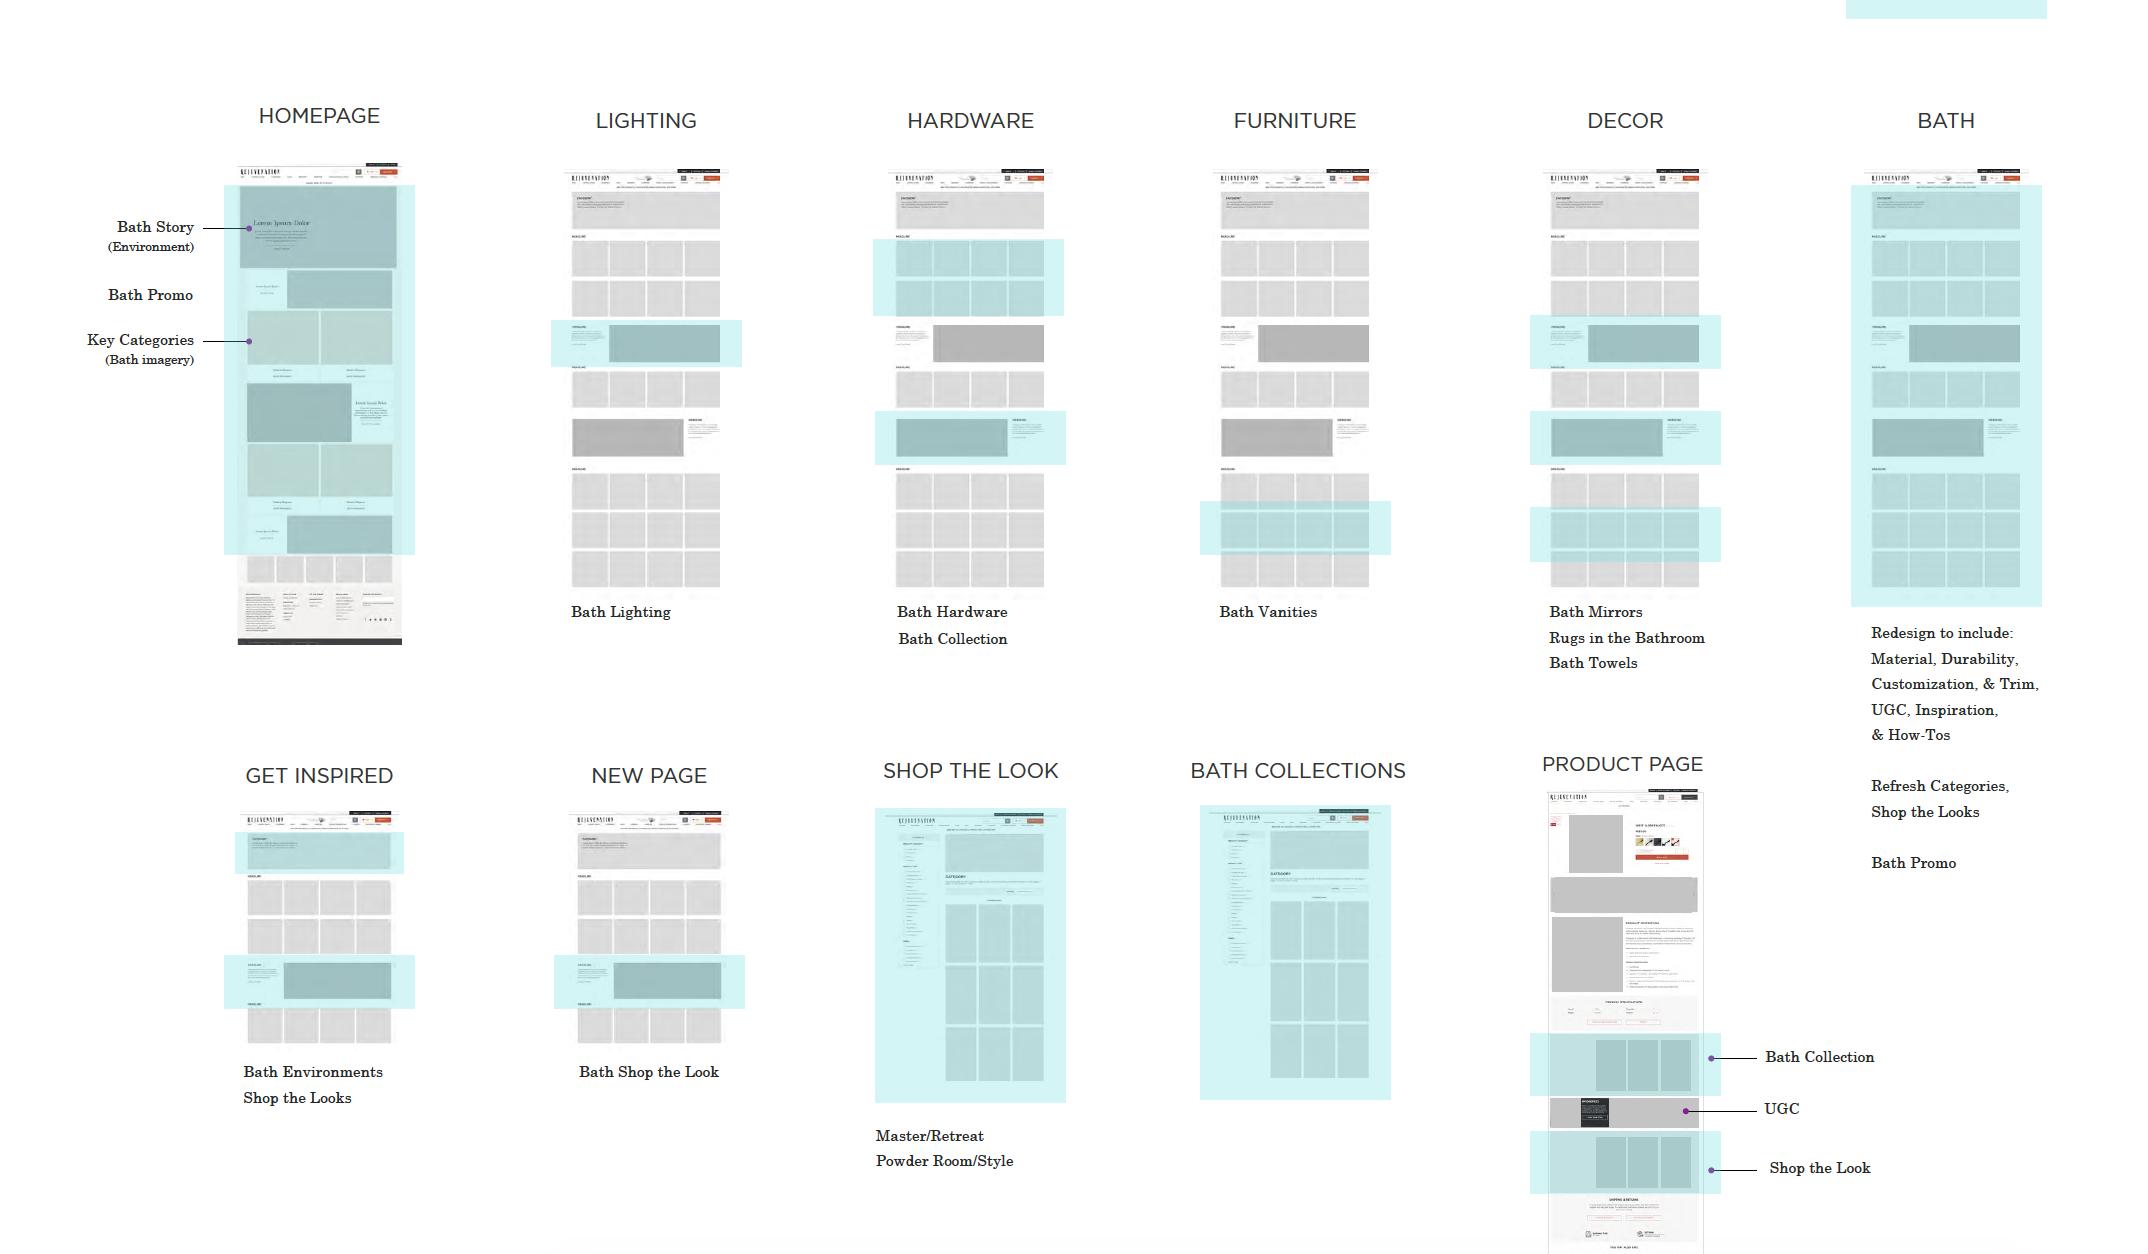
Navigational paths were developed to streamline the exploration of bath collections and products. Our strategy emphasizes the creation of circular shopping paths.
This site map outlines the content strategy, showing a visually cohesive digital shopping experience that facilitates product discovery.
Creative Update
The main landing page was completely reworked. Within the limitations, the redesigned landing page (depicted on the right) seamlessly integrates interactive features and storytelling, maintaining a consistent aesthetic. We restructured the page hierarchy to showcase frequently purchased products while highlighting larger, more considered purchases.
The enhanced user interaction on the main landing page directly correlated with a marked increase in the conversion rate.
Cohesive creative treatments were implemented across every stage of the user’s shopping journey.
Results
This campaign was seen as widely successful. Over the ensuing months, average order value (AOV) exhibited steady growth, culminating in a remarkable 31% year-over-year increase. Heatmap testing revealed a significant improvement in user engagement with an uptick in click rates on the new landing page across all devices.
Desktop 86.5% / 46.9%
Tablet 83.7% / 60.7%
Mobile ~86% / 51.7%


